Long-term Business Metrics to Track for eCommerce Success
Tracking metrics can help your online store grow and remain competitive. Here are the best insights to keep an eye on.
Published February 15, 2024

AI Summary
eCommerce metrics give you a clear picture of your store's health. They can help you understand how customers experience your store and products.
Still, it's easy to get lost in all the metrics out there. Figuring out the ones that are important—let alone how to interpret them—takes both time and resources, while the store's performance remains unchanged.
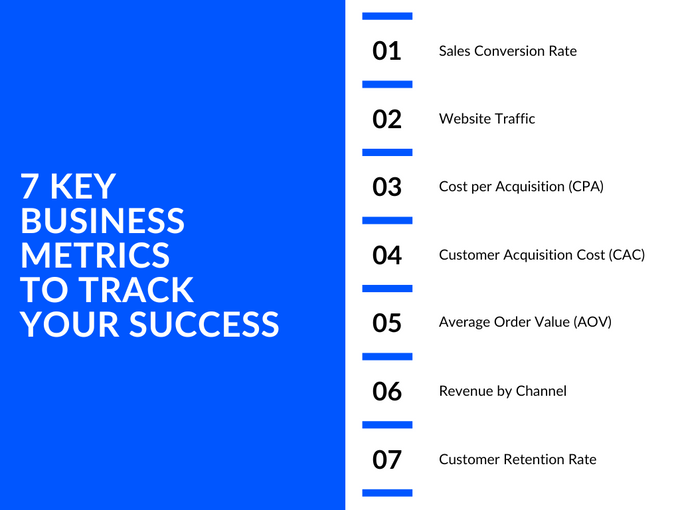
So let's talk about which long-term business metrics to focus on first and build from. We'll look at the following parameters:
- Sales conversion rate
- Website traffic
- Cost per acquisition (CPA)
- Customer acquisition cost (CAC)
- Average order value (AOV)
- Revenue by channel
- Customer retention rate
» Take a look at best Shopify analytics apps to boost your store's performance.
Meet the Expert
Arjel Vajvoda is the Head of Product at Motomtech and Shopify expert. With a background in software, Shopify and documentation, Arjel excels in crafting million-dollar SaaS products. As a Shopify expert, she propels her business' commitment to top-tier services.
Why Should You Track Metrics?
Tracking metrics means exercising and maintaining control of your business. You should know what's going well and capitalize on it while noting what can be improved—and to do that, you need the right data.
Gathering data from your store helps you:
- Manage your goals
- Assess your store's performance
- Establish what needs attention
- Check performance against benchmarks
» Want to get tracking? Here is our list of the best analytics apps for your store
7 Key Business Metrics for eCommerce
The seven key business metrics below help you measure a store's performance and, placed in a business and UX context, provide actionable insight on steps to take.
Sales Conversion Rate
Sales conversion rate shows how well your website turns visitors into paying customers. It highlights areas for improvement and guides your decisions for sustainable growth.
You want this figure to remain steady or to see small increases. Drops could be a sign that there are website issues that need addressing.
- What it measures: Sales conversion rate measures the ratio of transactions to sessions on a website.
- How it's calculated: SCR = Total transactions / Total visits x 100.
- Benchmarks: Benchmarks depend on industry. The average eCommerce sales conversion rate is around 2% to 3%.
- Data source: Typically provided by web analytics tools like Google Analytics.
- Difficulties and solutions: Challenges include grasping the context behind the numbers, such as differences in traffic quality. For more accurate insights, it's best to segment the data by traffic source or customer demographics.
» Need a sales tracker? Here are the 11 best apps for sales and profit tracking.
Website Traffic
Traffic arrives at your website via two sources—organic and paid. So when you look at traffic, you're looking to see how well your content ranks and attracts visitors whether it's from a paid campaign or your SEO efforts.
It's one of the metrics to track and focus on consistently because it stands in direct relation to website content.
- What it measures: Website traffic measures the volume of visitors to the site and their engagement.
- How it is calculated: Counts the total number of visits or page views on the website.
- Benchmarks: Benchmarks for website traffic vary by industry. Still, it's good to try and gauge them to assess a site's performance relative to competitors.
- Data source: Data is usually collected from web analytics tools and marketing platforms: Google Analytics, Google Search Console, SEMRush, Ahrefs, Similarweb, and others.
- Difficulties and solutions: It's often difficult to distinguish between quality and quantity of traffic. Looking at engagement metrics—average session duration and bounce rate—alongside website traffic, can help you understand the traffic type.
» Read this to learn how to increase traffic and sales for your store.
Case Study Luxury fashion retailer Budapester struggled with low conversion rates despite high website traffic. They made their unique selling propositions more explicit and improved the offers and policy communication, which increased their overall conversion rate by 12.5% and mobile conversion by nearly 30%.
Cost per Acquisition (CPA)
CPA tells you how much it costs to acquire a new customer. This is typically done at a granular level, focusing on the cost of acquiring a customer through targeted marketing campaigns. It helps you answer key questions like, is my marketing spend efficient? Am I attracting the right kind of customers? Can I afford to scale my marketing efforts?
A low CPA suggests you're effectively acquiring customers at a reasonable cost, while a high CPA might indicate inefficient marketing or attracting expensive customers with low lifetime value.
- What it measures: CPA measures the cost of marketing campaigns in acquiring new customers.
- How it is calculated: CPA = Total campaign cost / number of acquisitions (new customers or actions taken).
- Benchmarks: A good CPA value depends on industry standards, product type, and company objectives. In December 2023, the average CPA for eCommerce was 7.55%.
- Data source: CPA data comes from from campaign tracking tools (Google Ads, Meta Business Suite, HubSpot) and financial reporting.
- Difficulties and solutions: CPA can vary greatly depending on the campaign and market conditions. Compare your CPA to your customer lifetime value, which represents the average revenue a customer generates throughout their relationship with your store. Ideally, your CPA should be significantly lower than lifetime value for sustainable profitability.
Customer Acquisition Cost (CAC)
CAC represents the total sales and marketing cost required to earn a new paying customer over a specific period.
Commonly confused: CPA vs. CAC Both CPA and CAC are important metrics, but they measure different dimensions. CPA is the cost to get a new lead from one campaign. CAC is the total cost to get a paying customer from all channels. Use CAC for an overall cost view. Use CPA to check how well a campaign works.
- What it measures: The cost of sales and marketing efforts in gaining new customers.
- How it is calculated: CAC = Cost of Sales and Marketing / Number of New Customers Acquired
- Benchmarks: Specific benchmarks for CAC vary by industry and business model.
- Data Source: Obtained from financial reports covering marketing and sales expenditures and customer acquisition counts.
- Difficulties and solutions: Interpreting CAC can be challenging due to changes in marketing strategies and customer value. To overcome this, compare CAC with customer lifetime value (CLV) to notice trends and ensure a sustainable business model.
» Get ahead of the competition with our guide on competitive analysis
Average Order Value (AOV)
With AOV, you get to observe the average amount a customer spends on an order. It's a key metric for understanding your customer's purchasing behavior and strategizing to increase revenue.
- What it measures: Measures the average spending per transaction by customers.
- How it is calculated: AOV = Total revenue / Number of orders.
- Benchmarks: Benchmarks vary based on industry and the type of products sold.
- Data source: Data is sourced from eCommerce platforms and sales transaction records.
- Difficulties and solutions: Depends on seasonal trends and marketing campaigns. AOV is best analyzed in context with other metrics like transaction frequency and customer segments.
Revenue by Channel
Revenue by channel shows how your advertising and communication channels perform in terms of income. It’s a good indicator of where to invest your resources for optimal returns. New stores might want to focus on this metric to maximize revenue.
- What it measures: Revenue by channel measures the revenue generated from each marketing channel.
- How it is calculated: Displayed through web analytics tools like Google Analytics, which tracks traffic and revenue by source and medium.
- Benchmarks: Benchmarks would vary depending on the industry and the specific marketing channels used.
- Data source: The data is sourced from web analytics tools, usually Google Analytics.
- Difficulties and solutions: Interpreting this metric can get complex, depending on number of channels, changes in effectiveness over time, and different attribution models. To overcome these challenges, it's best to start with a limited number of channels, consistent measurement methods, and analyze trends over longer periods. Later on, expanding channels and drawing conclusions will be easier.
Pro tip: Optimize for mobile
Mobile sales make about 60% of all eCommerce sales around the world. Optimizing your website for mobile—simplifying navigation, using a responsive design, correct images, search function, and checking compatibility—is one of the easier and often overlooked ways to boost sales by this channel.
Customer retention rate
Customer Retention Rate measures how good your business is at keeping customers over time. It's a vital metric for eCommerce, related to customer satisfaction, loyalty, and the effectiveness of retention strategies. Established and longer-running eCommerce stores can especially benefit from this metric.
- What it measures: It measures the percentage of customers a company retains over time.
- How it is calculated: CRR = (Customers at the end of a period − Customers acquired during a period) / Customers at the beginning of a period x 100
- Benchmarks: Product-based companies typically see a 63% retention rate. For eCommerce stores, though, the customer retention rate typically sits at 15-30%.
- Data source: The data is usually sourced from customer relationship management (CRM) systems and sales databases.
- Difficulties and solutions: It can be difficult to discern between new and returning customers, and account for different buying cycles. To address these, use comprehensive CRM systems and segment data to separate customer types and purchase frequencies.
» Want happy customers? Tidio live chat and chatbot can help
From Insight to Action: Which eCommerce Metrics to Focus On?
Not every business metric is equally relevant at the same time. Depending on your business’s goals, stage, and strategies, you may want to prioritize one over the other.
However, the above metrics should be tracked, analyzed, and improved to ensure the success of your eCommerce store.
Over the next five years, these eCommerce business metrics will become more sophisticated and real-time. We'll likely see integrations of AI-driven predictive analytics and customer behavior modeling to further enhance decision-making and personalization.
» Learn how to use sample data to test website and personalization algorithms.


